
2022.02.23
Retail Day 2022 and E-barometer 2021 Annual Report
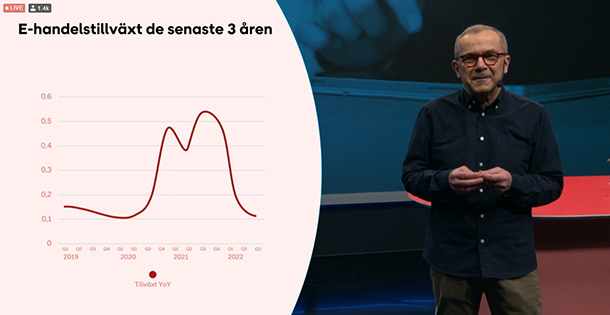
Digital transformation, marketplaces, price and sustainability were some of the key words during Retail Day 2022, which aired on February 22 and where E-barometer annual report 2021 was presented. During the first year of the pandemic in 2020, e-commerce in Sweden grew by a whopping 40 percent. In 2021, growth continued and e-commerce increased by 20 percent – however, it was a choppy year in that the increase was 53 percent in Q1, then the curve flattened out and Q4 landed at -1.2 percent.
”"2020 was a historic year for e-commerce and it was not easy to make a forecast for 2021, but the development has been impressive even this year. The growth means that e-commerce now accounts for around 16 percent of total trade," says Arne Andersson, e-commerce advisor affiliated with PostNord.
Grocery was the winning industry this year, with an increase of 35 percent. Another success story during the year is the consumer electronics industry (which includes appliances and household products in the report), which increased by 23 percent, which was somewhat unexpected since the industry is one of the most mature online. Looking only at Q4 2021, these two industries represent the extremes, as grocery was down 17 percent while consumer electronics was up 15 percent…
Trade – online or in store
In terms of the e-commerce share, it was 6 percent in grocery last year (in 2020 it was 4 percent), which corresponded to a turnover of SEK 19 billion. In consumer electronics, a threshold has been crossed, with the e-commerce share in 2021 being 51 percent (in 2020 it was 43 percent), which corresponds to a turnover of SEK 31 billion.
In the E-barometer you can also read that Elgiganten testifies that sales of household products and white goods were particularly strong during the second half of the year.
During Retail Day, it was noted that the digital transformation has been significantly accelerated by the pandemic, even within traditional industries such as grocery retail. One example that was highlighted as a role model is Inet, which in one year has climbed from 19th to 9th place on the list of e-commerce favorites, having both broadened its offering and invested in its own studio where they record various video clips about the products they sell.
When it comes to marketplaces, the development last year has been such that Chinese platforms such as Wish and Alibaba have lost ground (one wonders whether this is due to last year's shipping situation or consumers' sustainability awareness), while Amazon, for example, has climbed from 10th to 7th place. The undisputed leader among e-commerce favorites last year was, just like the year before, Apotea.
Used – price or durability
Almost half (45 percent) of consumers have shopped for used goods online at some point last year, and the biggest reason for shopping used is price – 44 percent cite price as the most important reason while 30 percent cite durability.
Magnus Ohlsson, Retail Strategist and Advisor Retailomania, mentioned during the panel discussion that according to a survey from Extreme Insight, sustainability ranked 8 out of 10, and price was number one, when it comes to buying clothes. One reason why sustainability ranks so low – when the topic is on most people's lips most of the time – is likely that it is so difficult to define compared to price, fit, appearance, etc., which are all parameters that are very easy to define.
Arne Andersson said that consumer behavior today is largely about freedom of choice and flexibility, which is what customers want when it comes to deliveries – and he noted that speed is something many are willing to pay for.
Marketing – Instagram or websites
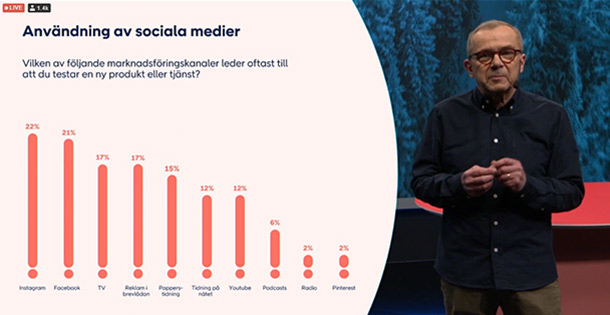
Interestingly, consumers themselves indicate that Instagram is the marketing channel that most often leads to testing a new product or service, while e-retailers indicate that the most important marketing channel is their own website (advertising on Instagram comes in tenth place for e-retailers).
When consumers are asked about the most important marketing channels, the top five look like this: Instagram (22 percent), Facebook (21 percent), TV (17 percent), Advertising in the mailbox (17 percent) and paper newspapers (15 percent).
If e-retailers are asked about the same thing, the top five look like this: Own website (62 percent), Newsletter via email (35 percent), Google ads (35 percent), Update information on Facebook page (25 percent) and SEO, i.e. search engine optimization or Search Engine Optimization (25 percent).
If you ask instead which channel consumers want to get more information about a specific product from, the website is at the top (35 percent), followed by comparison sites (33 percent) and internet forums (9 percent), while only 1 percent answer Instagram.
Loyalty – trust or not
Under the heading From customers to fans – the art of building loyalty There was talk about how loyalty can have different purposes for different channels and whether they can then work together to build value.
Daniel Erlandsson, CEO, Din ELON Butik, said that it starts with the ownership structure – trust in your employees is a requirement to create the conditions to instill trust in your customers.
The three-hour broadcast Retail Day 2022 is available at www.postnord.se/retailday
The 59-page report E-barometer 2021 Annual Report (published by PostNord in collaboration with Swedish Digital Trade and HUI Research) is available now at www.postnord.se/e-barometern
Ola Larsson
Images: Postnord