2022.02.01
Year-end at a record level
The industry's full year 2021 ended with a strong plus of just under 8 percent increase compared to 2020. If we compare it with the Covid-free normal year 2019, the industry has had a total growth of 21 percent over the pandemic period.

December doesn't quite reach last year
The industry ends 2021 with a December that, at -1.2 percent, does not quite match the previous year's December. Perhaps not entirely surprising, as December 2020 was an exceptional month in comparison with a 45 percent increase for SDA (small household appliances) and 14 percent for MDA (major appliances). Throughout the 4th quarter, we see an incipient trend of SDA sales slowing down compared to last year's record levels. For MDA, however, there is a strong upward trend in the 4th quarter.
The industry's record year 2021 is summed up
The industry's full year 2021 ended with a strong plus of just under 8 percent increase compared to 2020. If we compare it with the Covid-free normal year 2019, the industry has had a total growth of a whopping 21 percent over the pandemic period. Two record years in a row... If we look at the same comparison broken down for SDA, the increase is a whopping 35 percent and for MDA 16 percent compared to 2019.

A more high-value product mix
A continuing trend is that a more high-value product mix is being sold on the market. The difference between volume and value is greatest for household appliances (SDA), where increased demand for higher-value products in the coffee machines, kitchen appliances/assistants and dental care products segments is driving up the value of what is being sold on the market. Overall, however, SDA volume has ended up at the previous year's level (-0.1 percent).
Within MDA, the increased average prices are driven by a larger share of sales of built-in refrigerators and freezers, induction hobs/stoves and range hoods – both built-in, pull-out and wall-mounted.
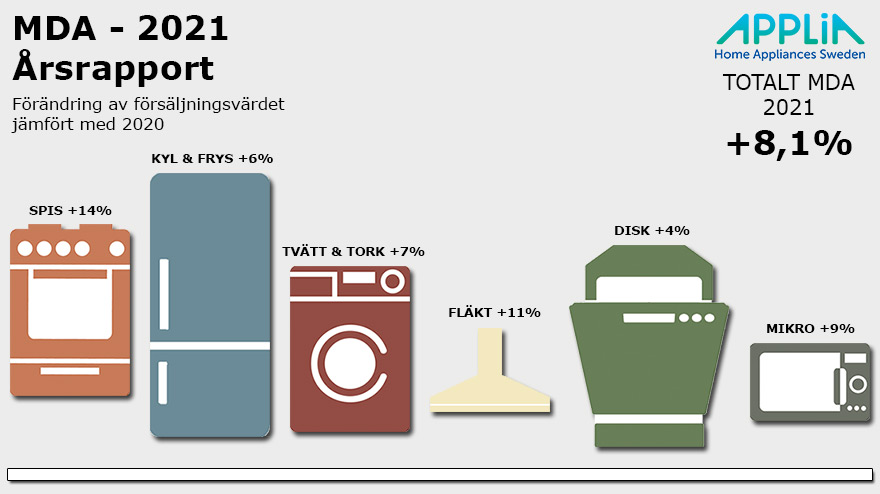
MDA: Overall positive in 2021
The product segments within white goods (SDA) are increasing by over 8 percent in total and all of these product segments are showing positive development during the full year 2021. The highest increase of 14 percent is seen in the 'COOKING' segment, where the categories built-in ovens and hobs (+19 percent) have the highest growth rates. In addition, fans also show above-average increases, as do the categories drying cabinets and tumble dryers (+15 percent), which are included in the 'WASHING & DRYING' segment.
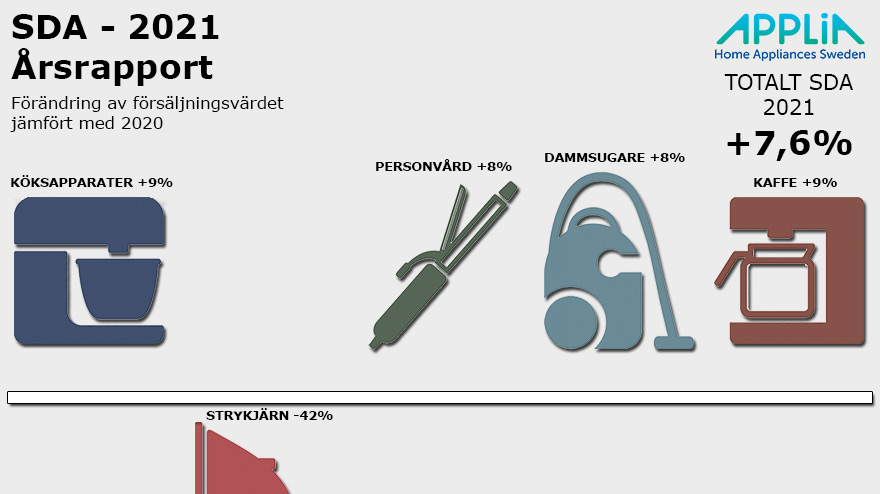
SDA: The ironing segment is taking a beating
The 'IRON' segment continues its cancer-like growth. This trend has been visible since the pandemic and one wonders how many shirts and blouses have not been ironed in this era of working from home?
If the steam has now run out of the iron market, things look even better in all other product segments within SDA. Coffee machines have had a brilliant development during the year until a slowdown occurred in Q4 for this category, but still ended up with a high 9 percent increase for the full year. Within personal care, it is dental care products (+15 percent) that continue to increase within the segment, while the products included in hair care and hair removal continue to struggle with a certain decline.
The big winner within SDA is the 'KITCHEN APPLIANCES' segment, which also includes the larger kitchen machines/assistants. These kitchen work machines are at the definitive peak of growth with over 30 percent growth in 2021!
Strong industry in comparison
How did our industry compare to other non-durable goods retail in 2021 in Sweden? Turnover for the entire retail sector in the country increased by 6.4 percent in 2021 compared to 2020 measured in current prices. This is shown by Statistics Sweden's preliminary retail index for December and the full year 2021.
The same source shows that sales in the non-durable goods trade during the full year, which includes our industry products, increased by 9.2 percent in current prices compared to 2020. But then we should be clear that it is mainly some sub-industries (clothing, shoes and other fashion) that come from a very low level in 2020 and drive up the increase for non-durable goods. For example, the shoe and bag trade showed the strongest increase with 15.5 percent for the full year.
Our industry companies are now leaving a very strong year 2021 behind and are looking forward to new challenges in a hopefully pandemic-free new year.
Kent Oderud, Chairman APPLiA